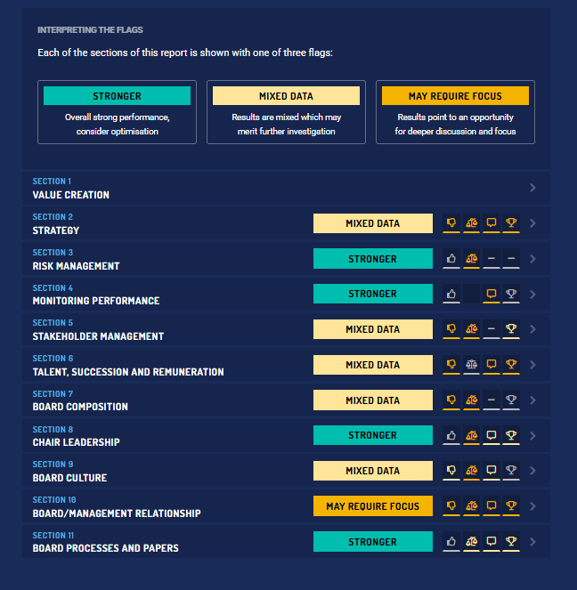
Layer 1: Summary Page
The platform leverages AI to produce a comprehensive narrative summary of the evaluation's key findings. These insights help identify the key drivers of value creation for the Board, while also highlighting pertinent findings across all assessed performance areas—celebrating strengths and pinpointing areas that may require further focus and development.
Layer 2: Discussion Report
The Discussion Report provides a clear, one-page dashboard for each performance area assessed, bringing key insights to the surface in a digestible format. The section summary distills the most important highlights from the quantitative data, whilst an overall sentiment snapshot calls out both notable strengths and improvement areas.
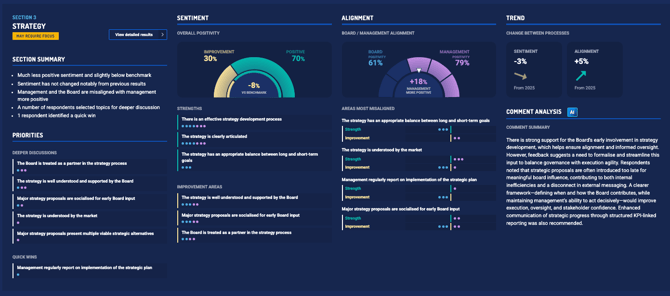
You’ll also see how closely aligned the Board and management are on each topic, supported by AI-generated summaries that distil the core themes from qualitative feedback. The report identifies key priorities—whether they're areas for deeper exploration or quick wins—and, where available, includes trend analysis drawn from multiple years of evaluation data to show how perspectives have evolved over time.
Layer 3: Detailed data
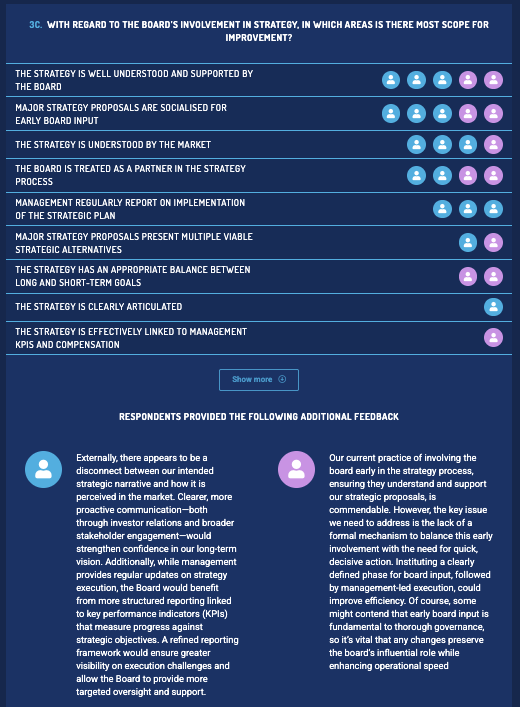
The detailed data section presents the full evaluation results, question by question, allowing you to view the complete response breakdown alongside the verbatim qualitative commentary.
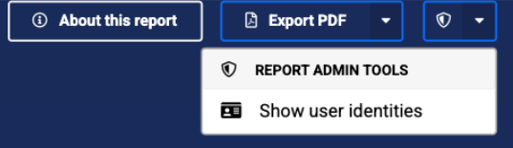
User identities
As a consultant, you can reveal respondent identities to support your interview preparation:
1) Click on the shield icon in the top right-hand corner of the platform
2) Select 'Show user identities'
3) The report will now reload with user initials included in the respondent icons
Please use this feature with discretion. Attributable data is for your internal use only and must not be shared directly with respondents.